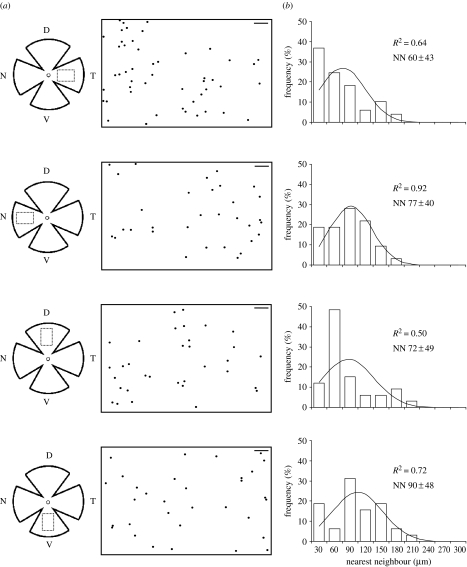
Figure 4.
Distribution of pRGCs in the dunnart retina. (a) Schematic diagrams of flat-mounted retinae. The circle illustrates the approximate position of the optic nerve and the dotted rectangle delimits the sampled areas. D, dorsal; T, temporal; V, ventral; N, nasal. The corresponding distribution plots are shown to the right (scale bar, 100 μm). (b) Histograms represent the nearest-neighbour distributions for melanopsin RGCs in each region. The fit of the data to a normal distribution is indicated in each plot by the R2 value.

