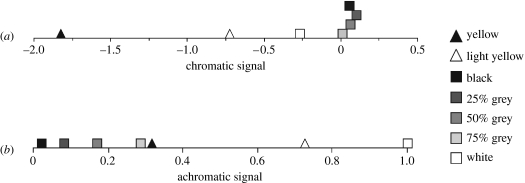
Figure 3.
Perceived spectral composition and intensity of the different claw colours. (a) The chromatic signal based on the difference between the natural logarithms of the receptor signals. The greys are spectrally similar, although white differs slightly. Both yellows are spectrally distinct from the greys and each other due to the low saturation of light yellow. (b) The achromatic signals based on the normalized sum of the two receptor signals. The greys differ significantly in intensity, as do dark and light yellow, which fall between 75% grey and white.

