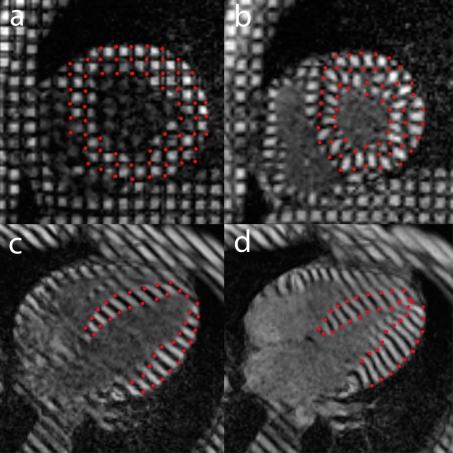
Fig. 2.
Example of MRI study with 2D tagging analysis. Tagging in cardiac short axis (a,b) and horizontal long axis (c,d), end–diastolic (left) and end–systolic time frame (right). Tracking of the grid intersections (indicated in red) on the short axis views, and the intersections of the tags with the endo- and epicardial border (indicated in red) on the long-axis views, allow analyzing the local myocardial deformation.

