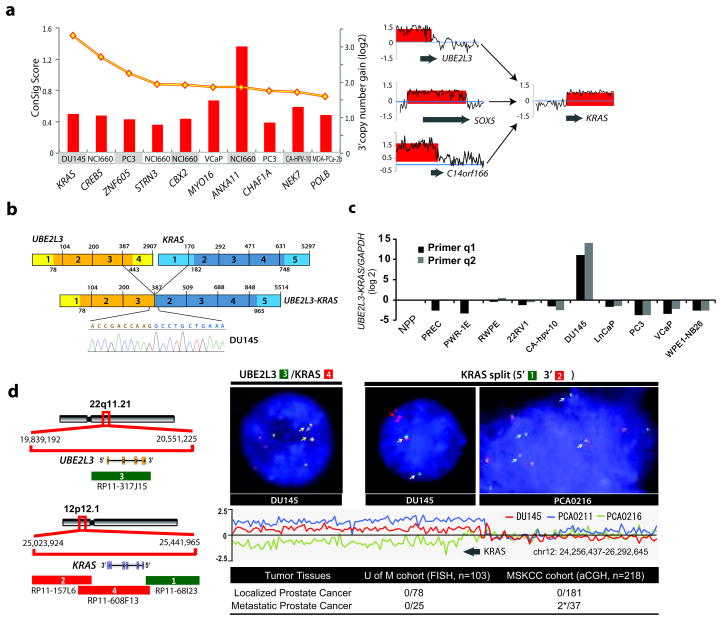
Figure 1. Identification and characterization of a novel KRAS rearrangement in metastatic prostate cancer.
(a) Left panel, amplification breakpoint analysis and ConSig scoring of 3′ amplified genes from a panel of advanced prostate cancer cell lines nominated KRAS as a fusion gene candidate with 3′ amplification in the DU145 prostate cancer cell line. The ConSig scores are depicted by the yellow line and the level of 3′ amplification for each 3′ fusion gene candidate is depicted by red columns. Right panel, matching the amplification level of 5′ amplified genes in DU145 cells nominates SOX5, C14orf166, and UBE2L3 as 5′ fusion partner candidates for KRAS. The relative quantification of DNA copy number data from the genomic regions 1Mb apart from the candidate fusion genes is shown. The x-axis indicates the physical position of the genomic aberrations. The fusion partners are indicated by grey arrows. (b) Schematic of sequencing results from Reverse Transcription PCR revealing fusion of UBE2L3 with KRAS in DU145. Structures for the UBE2L3 and KRAS genes have their basis in the Genbank reference sequences. The numbers above the exons (indicated by boxes) indicate the last base of each exon. Open reading frames are shown in darker shades. The exons of UBE2L3-KRAS fusion are numbered from the original reference sequences. Line graphs show the position and DNA sequencing of the fusion junction. (c) A panel of prostate cancer cell lines was analyzed for UBE2L3-KRAS mRNA expression by SYBR assay with the fusion primers. * NPP, normal prostate pool. (d) Left panel, the genomic organizations of UBE2L3 and KRAS loci are shown in the schematic, with red and green bars indicating the location of BAC clones. Genes are shown with the direction of transcription indicated by the arrows and exons indicated by bars. Right panel, FISH assay (upper) and copy number data analysis (lower) confirms the fusion of UBE2L3 to KRAS in DU145 cells and recurrent rearrangements at the KRAS locus. The left FISH figure shows three copies of fusion signals as indicated by yellow arrows, using co-localizing probes for the fusion. The right FISH figure shows triplicate KRAS 3′ signals in DU145, and 3′ deletion of KRAS in a metastatic prostate tumor, PCA0216, using probes that tightly encompass the KRAS locus. Relative quantification of copy number array CGH data at the KRAS locus in DU145, and metastatic prostate tumors PCA0211 and PCA0216 are shown in the middle panel. The lower panel displays a summary of KRAS rearrangements revealed by FISH and copy number analysis of a series of prostate cancer tissues from the University of Michigan (UM) and Memorial Sloan-Kettering Cancer Center (MSKCC). Table indicates the number of positive cases divided by the total number of cases evaluated. *Positive cases: PCA0211 (spine metastasis), 3′ amplification; PCA0216 (bladder metastasis), 3′ deletion.

