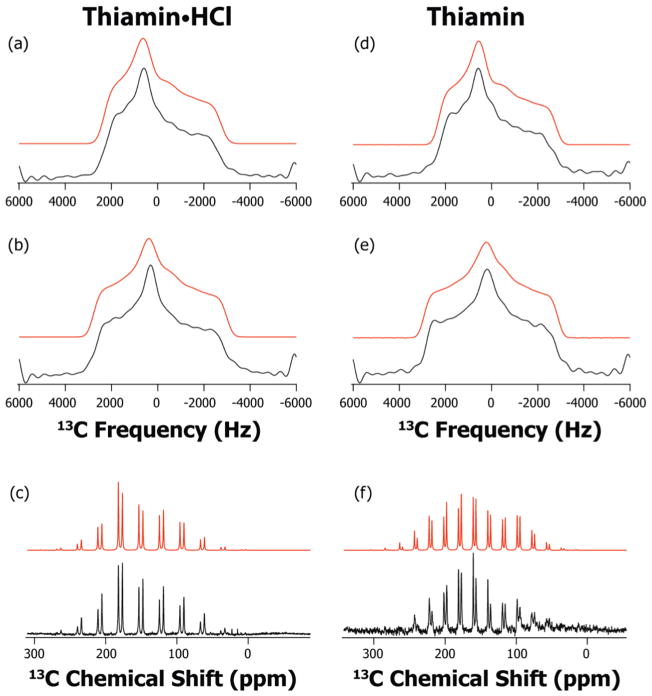
Figure 2.
13C ROCSA and slow-MAS spectra of Th•HCl and Th: experimental (black) and simulated (red). a) ROCSA spectrum of C2 of Th•HCl; b) ROCSA spectrum C6′ of Th•HCl; c) slow-MAS spectrum C2 and C6′ of Th•HCl at 2900 Hz rotor frequency; d) ROCSA spectrum of C2 of Th; e) ROCSA spectrum of C6′ of Th; and f) slow-MAS spectrum of C2 and C6′ of Th at 2075 Hz rotor frequency.

