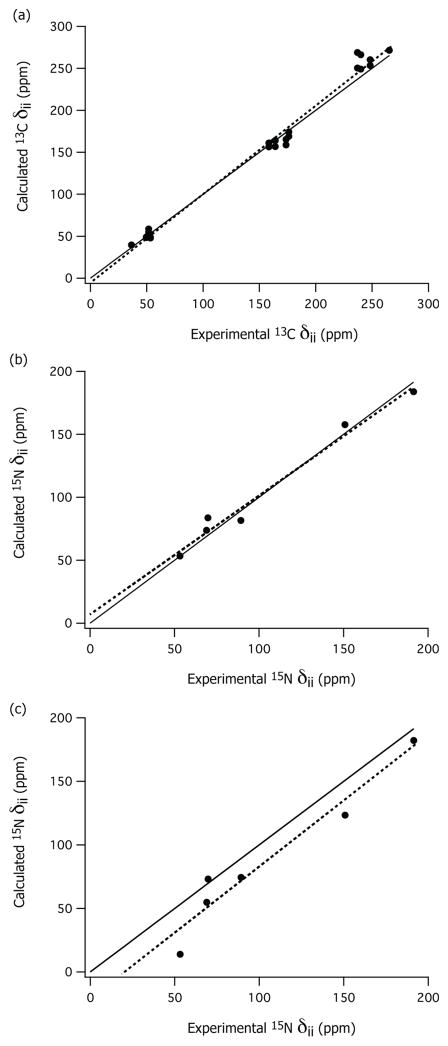
Figure 4.
Correlation between the principal components δii of the calculated (DFT) and experimental (NMR) chemical shift anisotropy tensors of Th•HCl and Th: a) 13C of C2 and C6′; b) 15N of N4′ with chloride anions; and c) 15N of N4′ without chloride anions. The solid lines in both figures indicate perfect agreement (δcal = δexp), and the dotted lines are the least-square fits: (a) δcal = 1.05 * δexp − 4.88, R2 = 0.99; (b) δcal = 0.94 * δexp + 7.86, R2 = 0.98; and (c) δcal = 1.03 * δexp − 20.28, R2 = 0.94.

