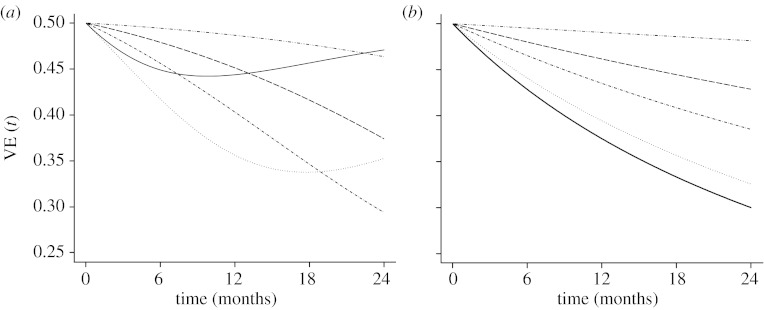
Figure 1.
Population VE based on the hazard ratio comparing vaccinated with unvaccinated subjects as a function of time and individual VE of 50%. (a) Exposure was generated assuming a mixing distribution of two Poisson distributions with means λ1=12 and λ2=2, with the probability of occurrence of λ2 from 0.1 to 0.9, as specified. Triple dot-dashed line, 0.1; dashed line, 0.3; dot-dashed line, 0.5; dotted line, 0.7; solid line, 0.9. (b) Exposure was generated assuming a continuous mixture of Poisson distributions (negative binomial) with different means and variances (means and variances were chosen to mimic the mean and variance of the two point distribution). Triple dot-dashed line, mean=11 and variance=20; dashed line, mean=9 and variance=30; dot-dashed line, mean=7 and variance=32; dotted line, mean=5 and variance=26; solid line, mean=3 and variance=12.

