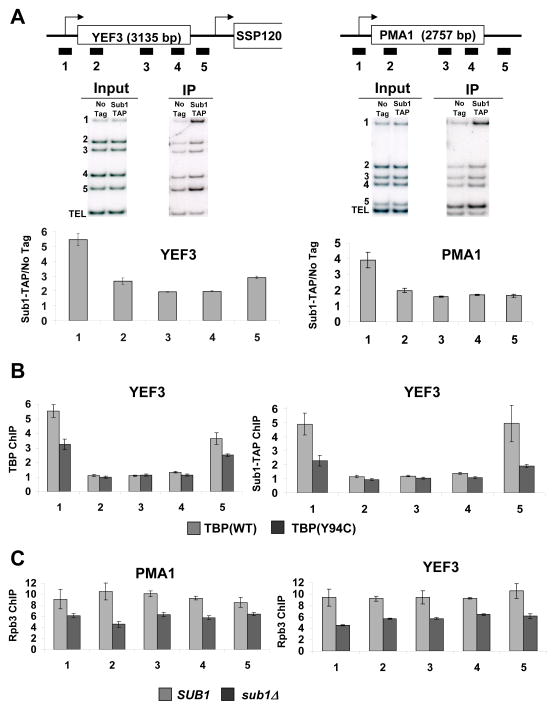
Figure 2. Sub1 is found at promoters.
(A) Schematic representations of the YEF3 and PMA1 genes used in ChIP experiments are shown at top. The box shows the open reading frame and arrows indicate transcription start site. Bars below the genes represent the positions of the ChIP PCR products (see Table S4 for primer sequences). ChIP was performed using a TAP-tagged Sub1 strain and representative gels are shown in middle panels. DNA coprecipitated with IgG-agarose (to precipitate TAP-tagged Sub1) was analyzed by multiplex PCR using primers shown in the schematic. The TEL PCR product is an internal background control from a nontranscribed region. The input control is used to normalize for PCR amplification efficiency of each primer pair. Quantitations of experiments are shown at bottom. The values shown represent the averages and standard errors (bars) from three independent experiments. (B) ChIP analysis at the YEF3 gene was performed for TBP (left) and Sub1-TAP (right) in wild-type TBP and TBP(Y94C) strains. Quantitation of triplicate experiments is as in part A. (C) ChIP of the Rpb3 subunit of RNApII at the PMA1 and YEF3 genes was performed in strains with SUB1 or sub1Δ backgrounds. Quantitation of triplicate experiments is as in part A.

