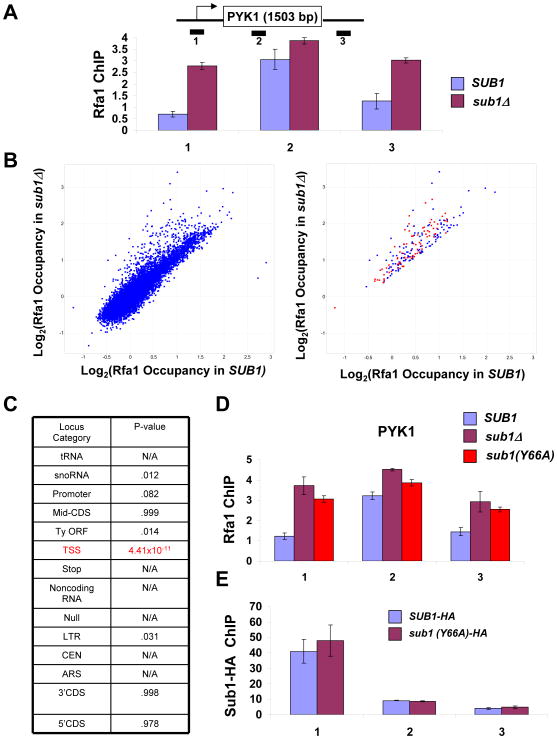
Figure 7. RPA crosslinks to transcription start sites in the absence of Sub1 activity.
(A) ChIP analysis at the PYK1 gene was performed using antibody against Rfa1 in SUB1 and sub1Δ strains. The values shown represent the averages and standard errors (bars) from three independent experiments. (B) Left panel: Scatter plot of all probes on the genomic arrays, comparing Rfa1 occupancy in SUB1 and sub1Δ cells. Right panel: Probes that are > 1.5 fold increased in sub1Δ cells are shown. Loci annotated as “transcription start sites” (TSS) are marked in red. (C) Coincidence test for increase in Rfa1 occupancy in sub1Δ cells for each locus category. P-value indicates probability a particular locus category is represented in the increased category by chance. N/A refers to categories that had no loci increased in sub1Δ cells. (D) ChIP analysis for Rfa1 at the PYK1 gene was performed using chromatin samples from sub1Δ, or sub1Δ cells carrying plasmid-borne SUB1 or SUB1(Y66A) alleles. Quantitation of triplicate experiments is as in part A. (E) ChIP for Sub1-HA was performed in a strain bearing a tagged version of wild type Sub1 or the Y66A mutant, and PCR analysis of the precipitated DNA was carried out on the PYK1 gene. Quantitation of triplicate experiments is as in part A.

