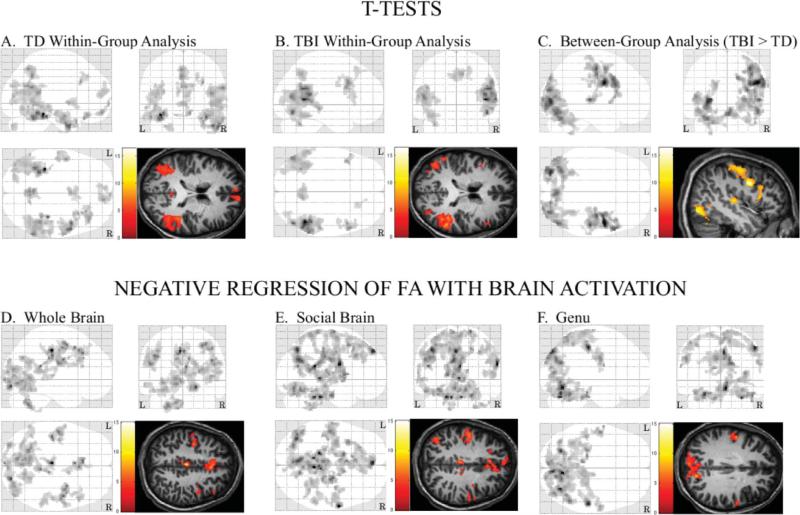
Figure 1.
Three-plane maximum intensity projections and image overlays for t-test contrasts and simple regression analyses. (A) Activation (social interaction minus “bumper car” contrast) for the TD adolescents. (B) Activation for adolescents with TBI. (C) Areas where SAT-related activation was greater within adolescents with TBI, relative to the TD comparison group. (D) Areas where there was a significant negative relation between activation during the SAT and the whole brain FA composite score. (E) Areas where there was a significant negative relation between SAT-related activation and the social brain FA composite score. (F) Areas where there was a significant negative relation between whole brain activation and FA within the genu of the corpus callosum. L = left side, R = right side.

