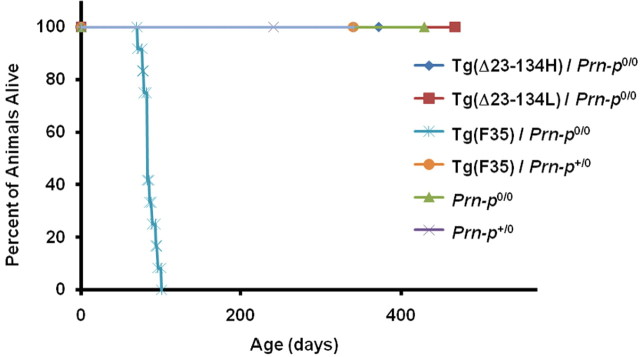
Figure 3.
Tg(Δ23–134) mice remain healthy, while Tg(F35) mice develop a fatal neurological illness. The plot shows the percentage of mice of the indicated genotypes remaining alive at each age. The number of mice, of either sex, in each group was 12 for Tg(Δ23–134H)/Prn-p0/0, 12 for Tg(Δ23–134L)/Prn-p0/0, 14 for Tg(F35)/Prn-p0/0, 7 for Tg(F35)/Prn-p+/0, 6 for Prn-p0/0, and 7 for Prn-p+/0.

