Figure 7.

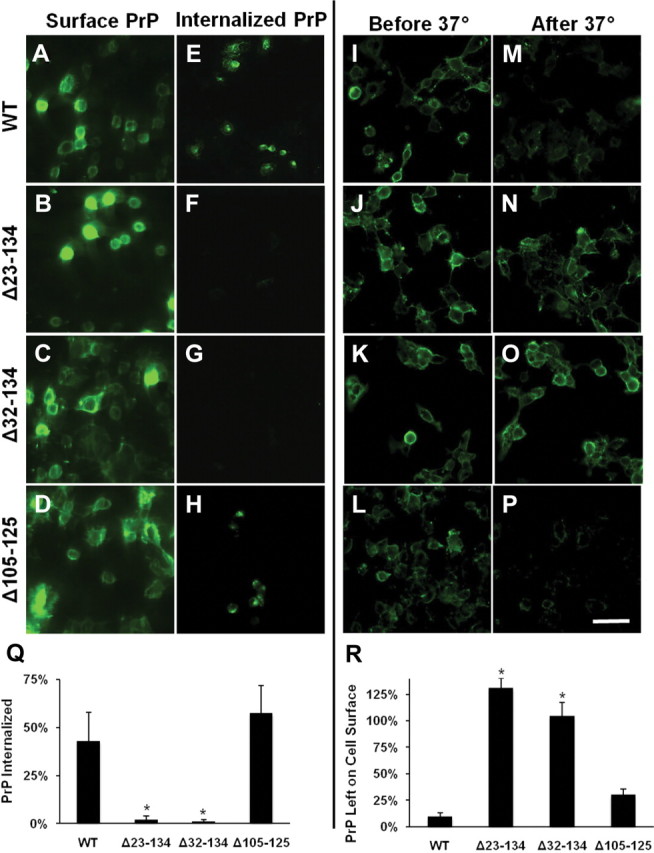
Δ105–125 PrP, but not Δ23–134 or Δ32–134 PrPs, are endocytosed in N2a and HEK cells. A–H, Living N2a cells expressing the indicated constructs were surface-labeled for PrP at 4°C. One set of cultures (A–D) was immediately fixed and stained with fluorescent secondary antibody to confirm the initial distribution of surface PrP. The other set of cultures (E–H) was warmed to 37°C for 1 h to allow endocytosis to occur, after which surface PrP was removed with trypsin, and then the cells were fixed, permeabilized, and stained with fluorescent secondary antibody to reveal the distribution of internalized PrP. Accumulations of PrP in endocytic structures are visible in E and H, but not in F and G. I–P, Living HEK cells expressing the indicated constructs were surface labeled for PrP at 4°C. One set of cultures (I–L) was immediately fixed and stained with fluorescent secondary antibody to confirm the initial distribution of surface PrP. The other set of cultures (M–P) was warmed to 37°C for 1 h to allow endocytosis to occur, after which cells were stained with fluorescent secondary antibody without permeabilization to reveal the amount of PrP remaining on the surface. Loss of surface PrP, indicative of endocytosis, is evident in M and P, but not in N and O. Scale bar: (in P) A–P, 50 μm. Quantification of PrP endocytosis using ImageJ software was performed by measuring the average pixel intensity of PrP immunofluorescence inside the cell (Q) or on the cell surface (R) after warming to 37°C compared with the initial surface immunofluorescence. PrP signals were normalized to fluorescence signal for DAPI, as a measure of cell number. The bars show mean values ± SEM. The asterisks indicate values that are significantly different from those for WT PrP (p < 0.001).
