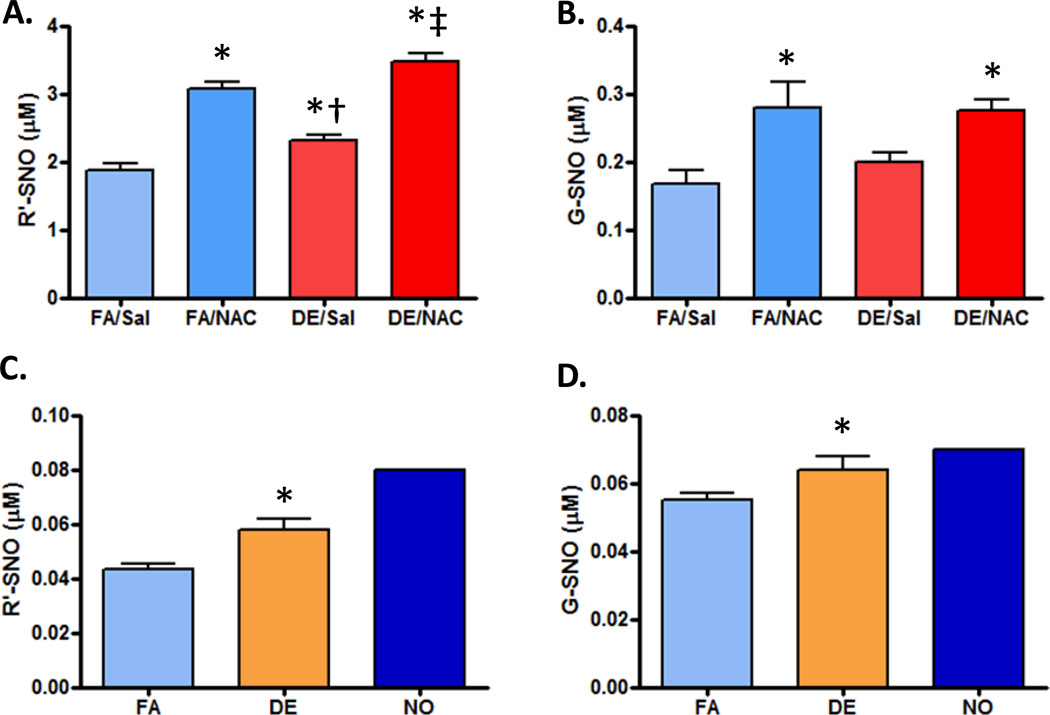
Figure 2. S-nitrosothiols (SNO) levels in the plasma and aortas from exposed animals.
A) Plasma levels for all SNO groups (R’-SNO) in control and exposed animals with or without NAC (N=6/gp). B) Plasma concentrations of glutathione-s-nitrosothiols (G-SNO) in the normal and exposed animals (N=6/gp). C) Aortic levels of all SNO moieties (R’-SNO, from cellular components <10 kD; N=6/gp, except NO, where N=1) D) Aortic G-SNO levels following FA, DE or NO exposure (N=6/gp, except NO, where N=1;
- p<0.05 vs FA/Saline and FA/NAC control,
- † p<0.01 vs. DE/NAC and FA/NAC;
- ‡ p<0.01 vs. DE/Sal and FA/NAC. Note: too few samples in NO-exposed group for inclusion in test).

