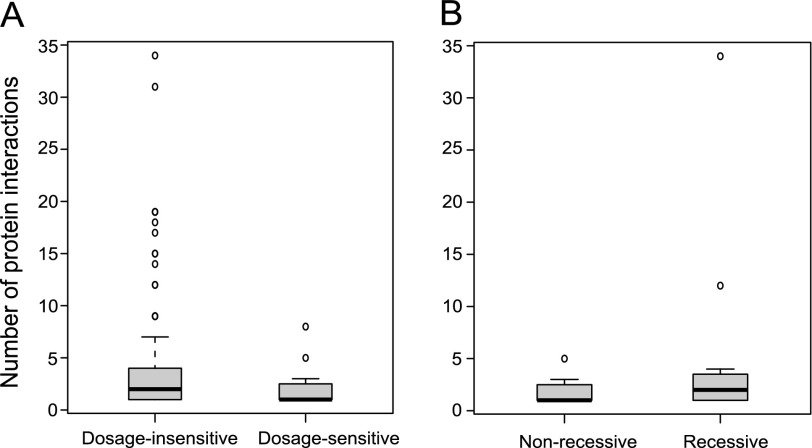
FIG. 7.—
The degree of protein interactions for CNV genes. (A) The number of protein interactions for dosage-sensitive and dosage-insensitive CNV genes is plotted. Dosage-sensitive genes have significantly more protein interactions. (B) The number of protein interactions for recessive and nonrecessive CNV genes is plotted. Recessive genes appear to have more protein interactions than nonrecessive genes. However, the difference is not significant. Bold horizontal bars are the median value, the box is the interquartile range, and the whiskers indicate the 95% confidence interval.

