Figure 1.

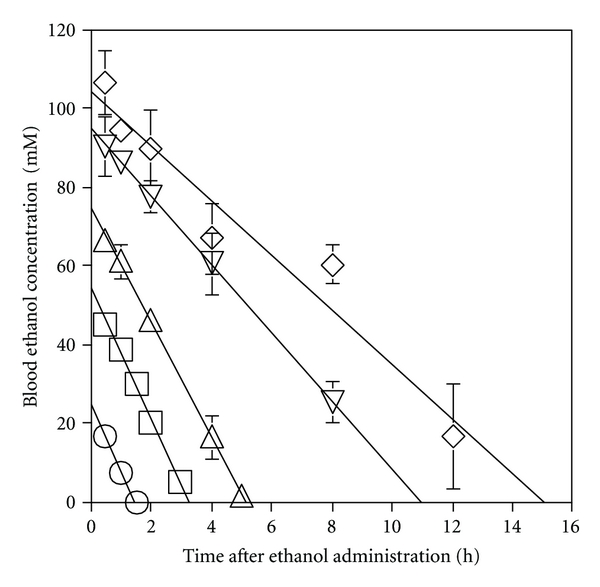
Time course of blood ethanol concentration in mice after ethanol administration (i.p.) at various doses. Each plot represents the mean ± SD of 3 mice. ○ 1 g/kg; □ 2 g/kg; ▵ 3 g/kg; ▿ 4.5 g/kg; ⋄ 5 g/kg.

Time course of blood ethanol concentration in mice after ethanol administration (i.p.) at various doses. Each plot represents the mean ± SD of 3 mice. ○ 1 g/kg; □ 2 g/kg; ▵ 3 g/kg; ▿ 4.5 g/kg; ⋄ 5 g/kg.