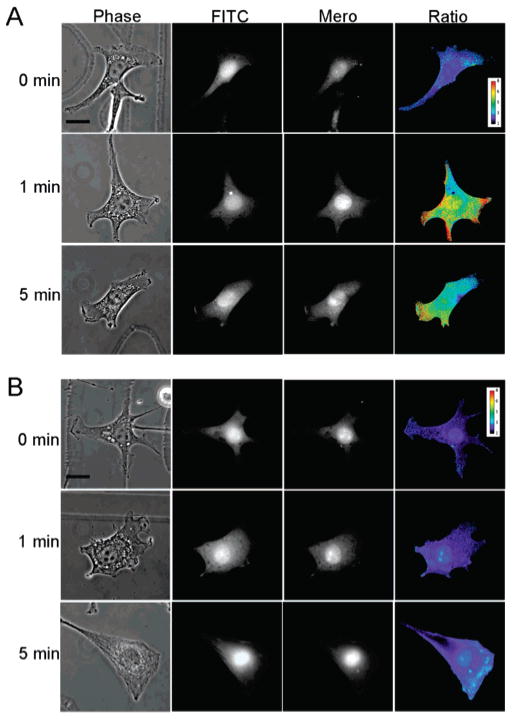
Figure 8.
S100A4 activity in LPA-stimulated fibroblasts. (A) Cells were injected with a 1:2 ratio of Fluo-S100A4:Mero-S100A4, stimulated with LPA for the indicated times and fixed. A representative cell for each time point is shown with purple to red signifying low to high activation. At 1 min poststimulation, S100A4 activation is restricted to cell extensions with no activated S100A4 detected in the cell body. This pattern of activation was very similar in the 6 cells examined at 1 min and the 8 cells examined at 5 min. (B) Cells were injected with a 1:2 ratio of Fluo-S100A4:Mero-S100A4 in a buffer containing 1 mM EGTA, stimulated with LPA for the indicated times and fixed. A representative cell for each time point is shown with purple to red signifying low to high activation. No activation of S100A4 is detected in cells 1 min poststimulation (10 cells were examined). Scale bar = 20 μm.

