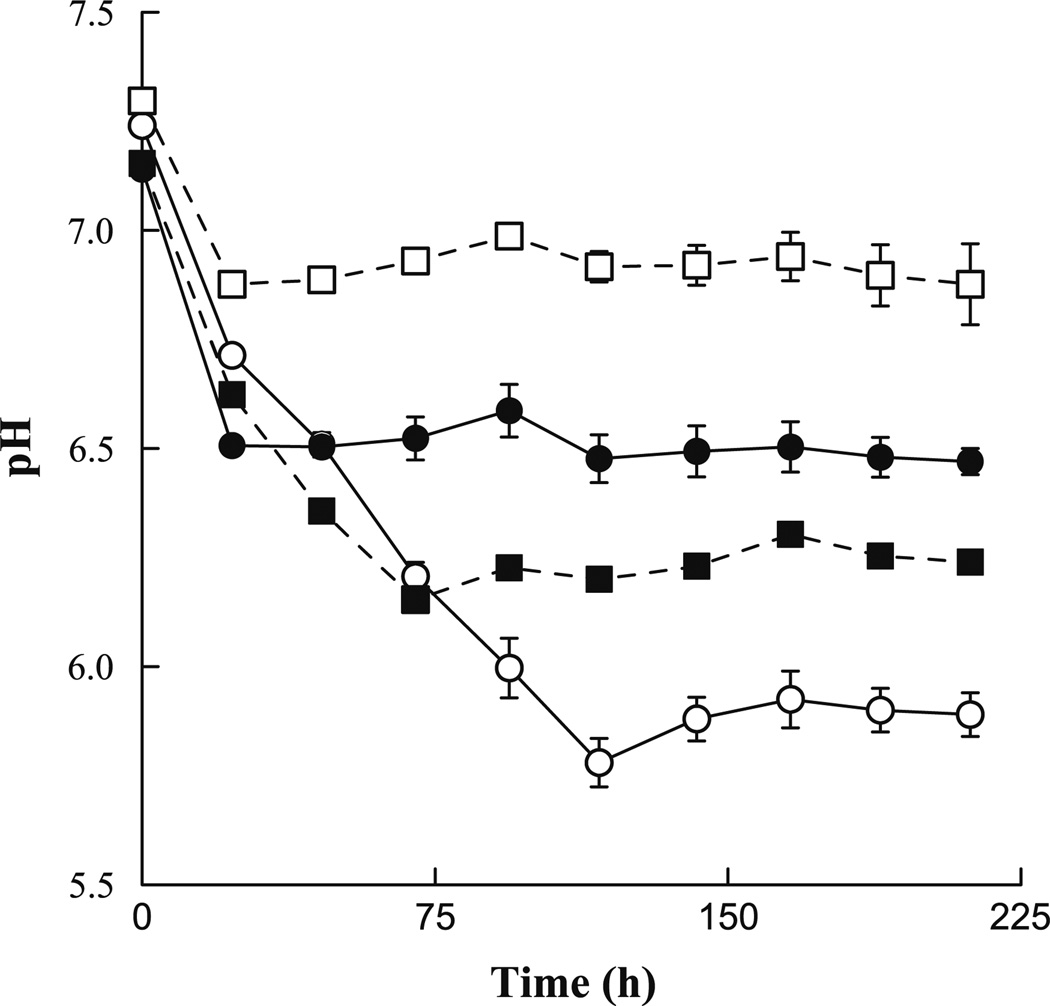
Fig. 2.
Measured pH of batch slurry incubations with varying levels of nitrogen amendment. Circles indicate normal nitrogen loading, identical to bioreactor conditions, with open circles representing a monthly-fed condition and closed circles a weekly-fed condition. Squares indicate a modified nitrogen load. The open squares represent a monthly-fed condition with decreased nitrogen loading and closed squares represent a weekly-fed condition with increased nitrogen loading. Data points and error bars are the average and standard deviation, respectively, of triplicate incubations

