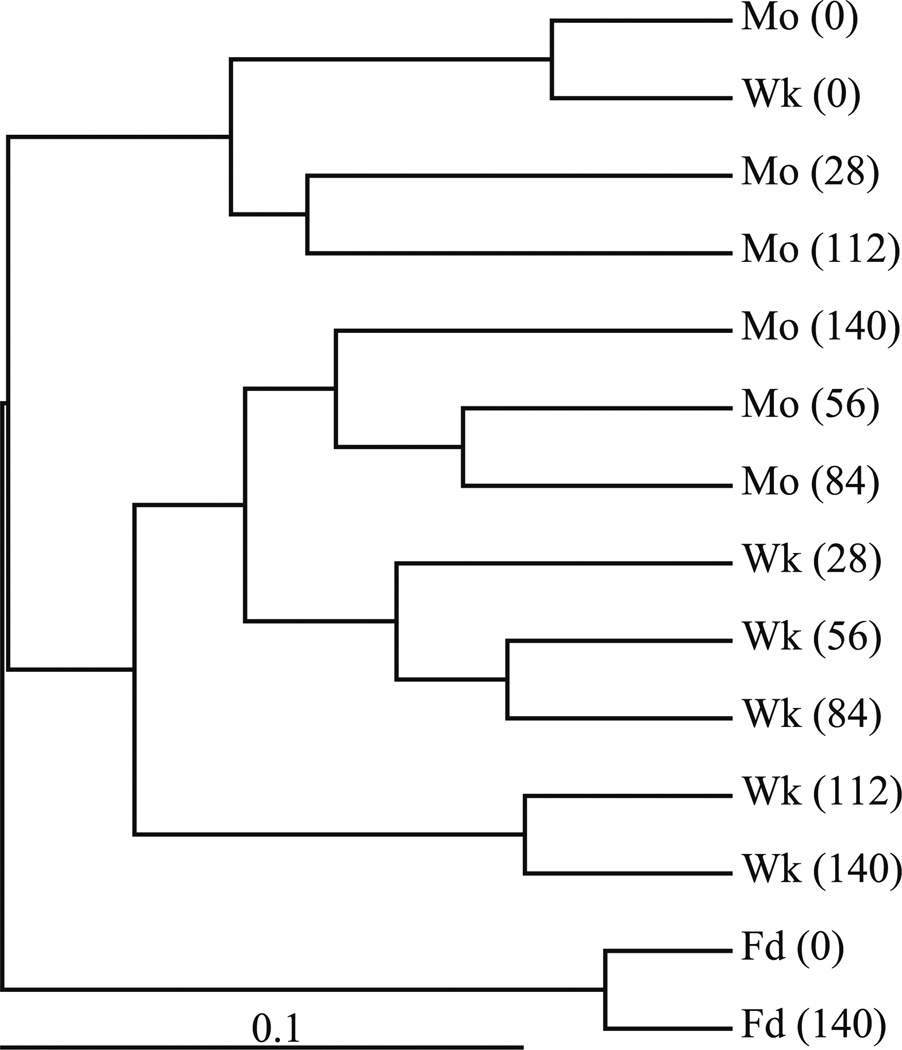
Fig. 4.
Weighted Fast UniFrac cluster tree showing the relationship of communities in the feed soils and bioreactor samples to one another based on pyrosequence libraries. Abbreviations are the source of the library followed by the sampling time (days after start of semi-continuous operation) in parentheses. Mo Monthly-fed bioreactor, Wk weekly-fed bioreactor, Fd feed soil. The scale bar is the distance between clusters in UniFrac units

