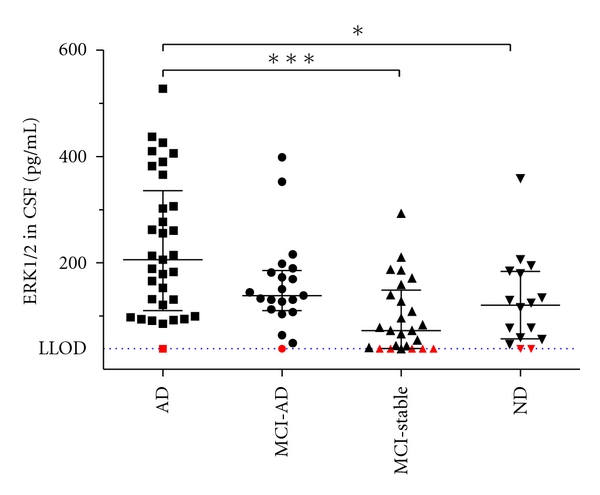
Figure 1.

Scatterplot showing CSF levels of ERK1/2 in the 4 diagnostic groups. The bars indicate medians and the interquartile ranges. The red symbols indicate those 9 samples with signals below LLOD that are reported here arbitrarily as 39 pg/mL. The differences in rank sums between the AD and the ND groups and between AD and MCI-stable were statistically significant: *P < 0.05, ***P < 0.001 (Kruskal-Wallis test followed by Dunn's multiple comparison test). LLOD: mean lower limit of detection of ERK in undiluted CSF (39.4 pg/mL).
