
Figure 2.
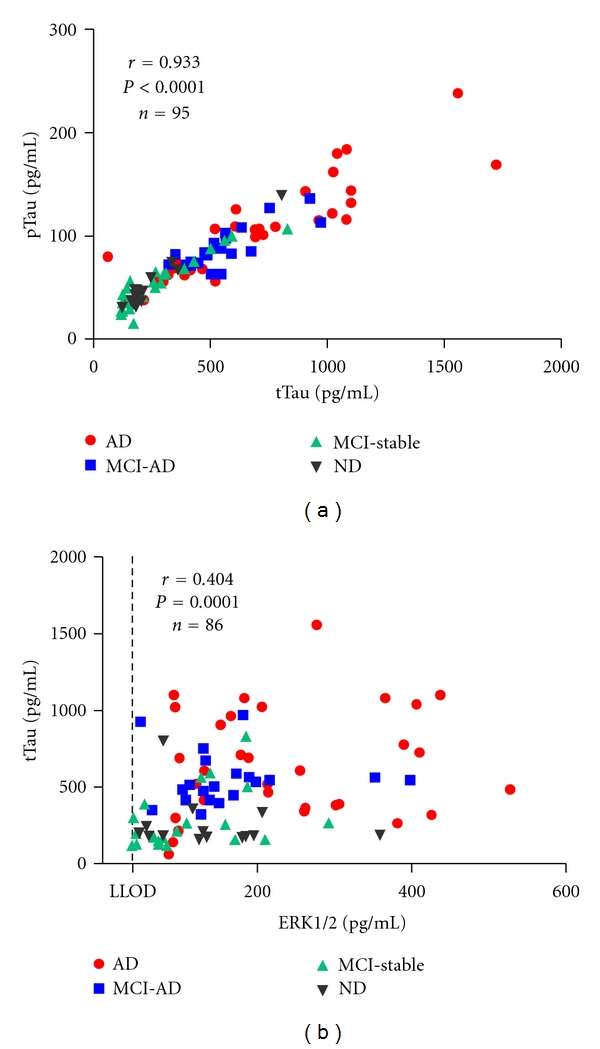
Correlations between tTau and pTau and between tTau and ERK1/2. In the whole sample, the CSF concentrations of tTau were significantly correlated with (a) pTau and (b) ERK1/2. ERK1/2 measurements below the LLOD of the respective assay plate (n = 9) were excluded from the Spearman correlation test.