
Figure 4.
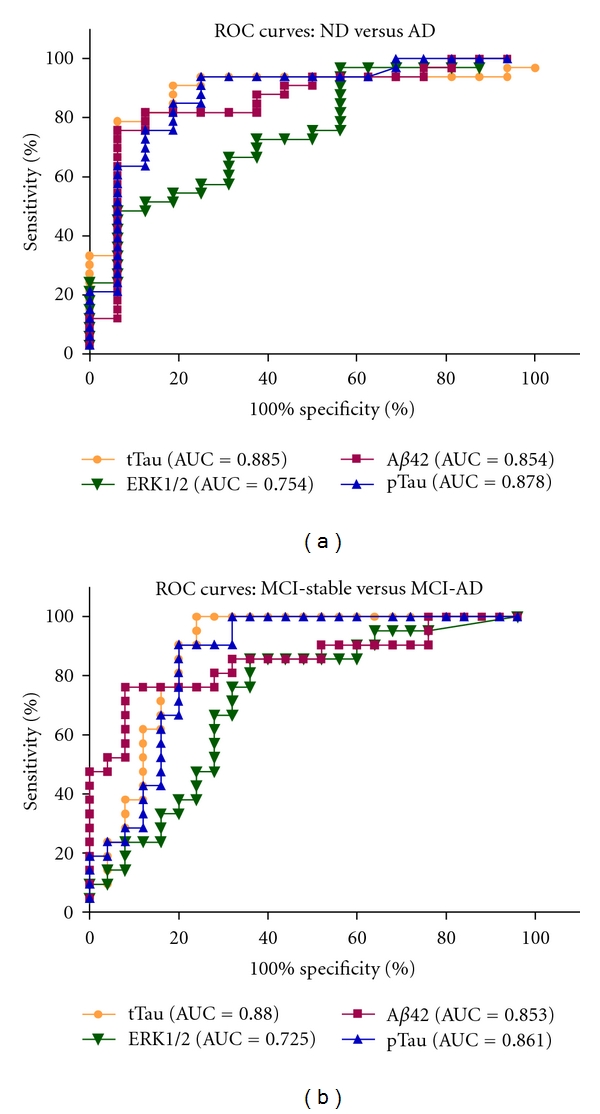
ROC curves for CSF-ERK1/2 levels and classical biomarkers: (a) ROC curves for Aβ42, tTau, pTau, and ERK1/2 (at baseline) for the discrimination between ND and AD. (b) ROC curves for Aβ42, tTau, pTau, and ERK1/2 (at baseline) for the discrimination between MCI-stable and MCI-AD. AUC: area under the curve. ERK1/2 measurements below LLOD are reported as 39 pg/mL in (a) and (b).