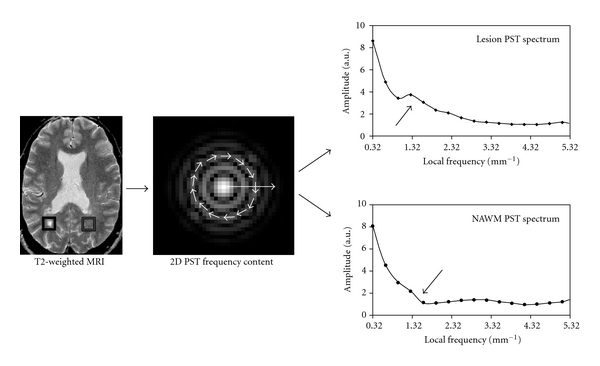
Figure 3.

Texture analysis of the same image demonstrated in Figure 2 using a spectral method (polar Stockwell transform, PST). The PST spectra were first calculated as radius and orientation in polar coordinate (middle figure with arrows in circle); then a 1-dimentional spectrum (texture curve) was obtained by integrating frequencies along the radial direction for each frequency and pixel. Plots in the right side of the figure demonstrate the average texture curve of central 5 × 5 pixels in the lesion (right box) and the contralateral NAWM of the patient. Note that the amplitude of the low-frequency range appears greater (coarser) in the lesion than in the NAWM (arrows).
