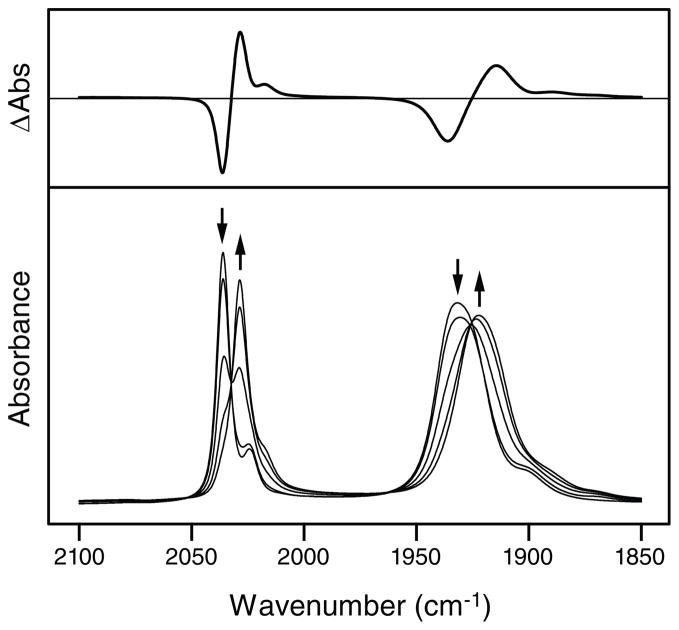
Figure 2.
Steady-state FTIR spectra (bottom) of saturated Re′-OEt in acetonitrile recorded during bulk reduction using an OTTLE cell. Arrows indicate spectral changes that occur upon reduction. The difference in absorbance between the fully reduced species and the initial species is also shown (top).

