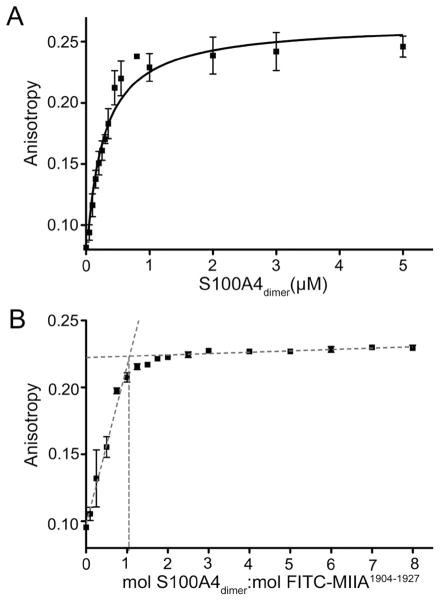
Figure 12.
Stoichiometry of binding of FITC-MIIA1904–1927 to wt-S100A4. (A) Fluorescence anisotropy measurements of wt-S100A4 binding to MIIA1904–1927 demonstrated that wt-S100A4 has an approximately 7-fold increased affinity for FITC-MIIA1904–1927 as compared to FITC-MIIA1909–1923. Values represent the mean ± standard deviation from two or three independent titrations. (B) Stoichiometry of binding of wt-S100A4 to FITC-MIIA1904–1927. wt-S100A4 binds to FITC-MIIA1904–1927 at a 1:1 molar ratio (wt-S100A4 dimer:peptide). Gray dotted lines represent the linear regression of the rise and plateau of the titration curve. Values represent the mean ± standard deviation from two or three independent titrations.

