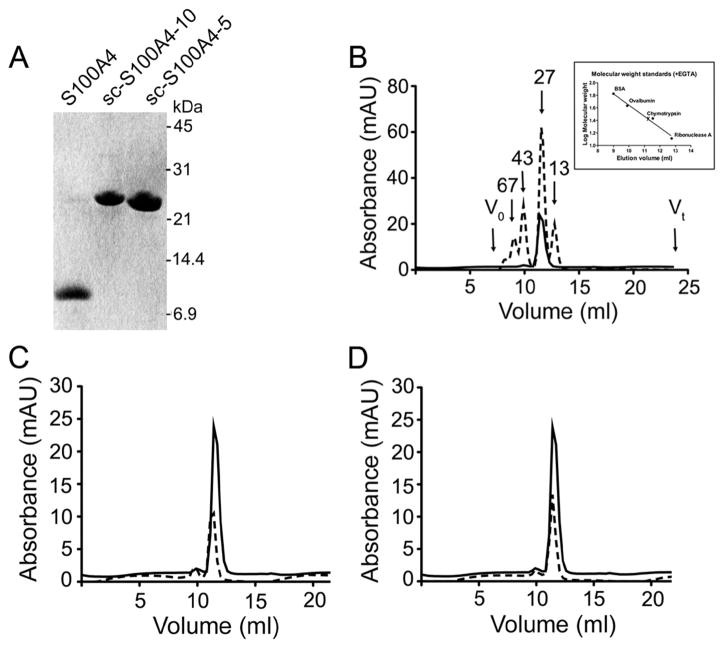
Figure 2.
Analytical gel filtration of sc-S100A4 proteins. (A) SDS–PAGE of purified wt-S100A4, sc-S100A4–5, and sc-S100A4–10 on a 12% Tris-Tricine gel. Molecular mass markers are indicated on the left. (B) Elution profile of wt-S100A4 (—) and protein standards (---) on a Superdex 75HR column in the presence of EGTA. The inset is a plot of protein standard molecular masses vs elution volume. (C and D) Elution profiles of sc-S100A4–5 and sc-S100A4–10 in the presence of EGTA: wt-S100A4 (—) and sc-S100A4–5 and sc-S100A4–10 (---).

