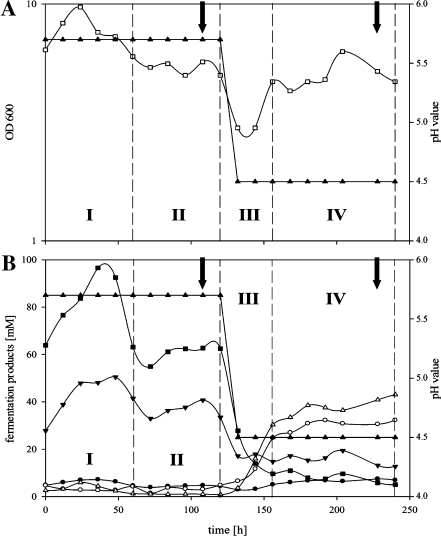
Fig. 1.
“Master” fermentation of C. acetobutylicum. Monitored 240 h after starting the medium supply at t0. a shows pH (filled upright triangles) and optical density (empty squares); b illustrates the pH (filled upright triangles) and the fermentation products butyrate (filled squares), acetate (filled inverse triangles), butanol (empty upright triangles), acetone (empty circles), and ethanol (filled circles). Roman numbers highlight the four different phases, I: starting of continuous culture; II: establishing of steady-state growth at pH 5.7; III: switch of pH from 5.7 to 4.5; IV: establishing of steady-state growth at pH 4.5 of the fermentation. Arrows indicated sampling points for proteome and transcriptome analyses at the end of phase II and phase IV

