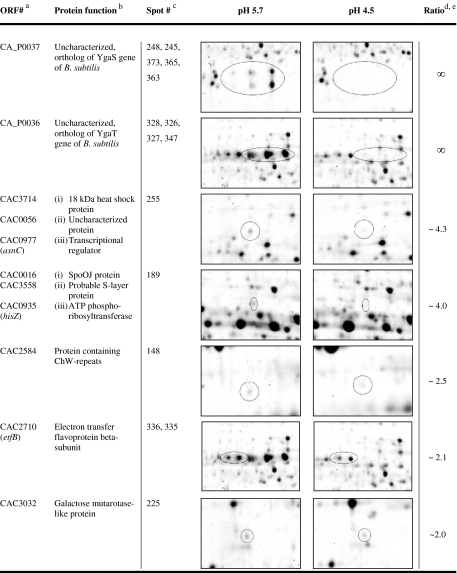
Table 1.
Proteins with increased (≥2.0) abundance in the acidogenesis at pH 5.7
aProteins of spots with more than one polypeptide are listed in their identification order
bNames based on Nölling et al. (2001)
cCorresponding spot numbers in Fig. 2
dIf more than one protein spot was detected, the average of all protein spots is shown (SD 4)
eThe sign for nonterminating (∞) indicates that the protein was not detectable at pH 4.5

