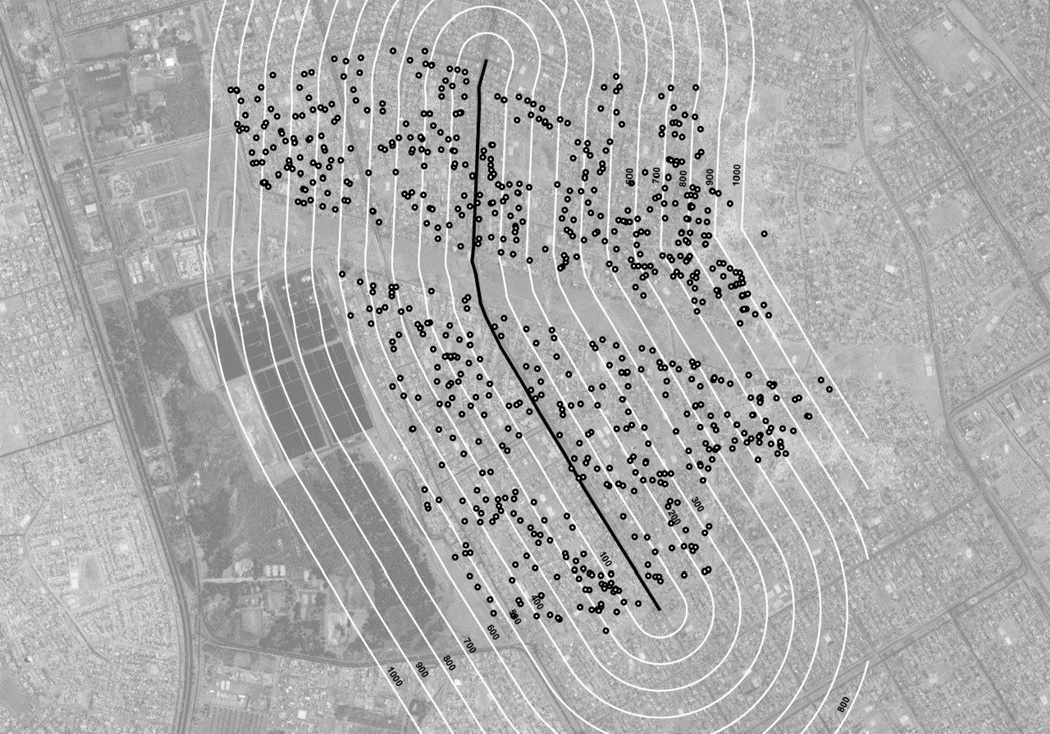
Figure I. Distribution of the 725 study households in Pampas de San Juan around the main avenue, Lima, Peru.
The thick, black line represents the main avenue (Avenida Miguel Iglesias) that intersects our study community. The black circles represent households in our study. The thin, white lines represent distances from the avenue in 100 meter intervals.

