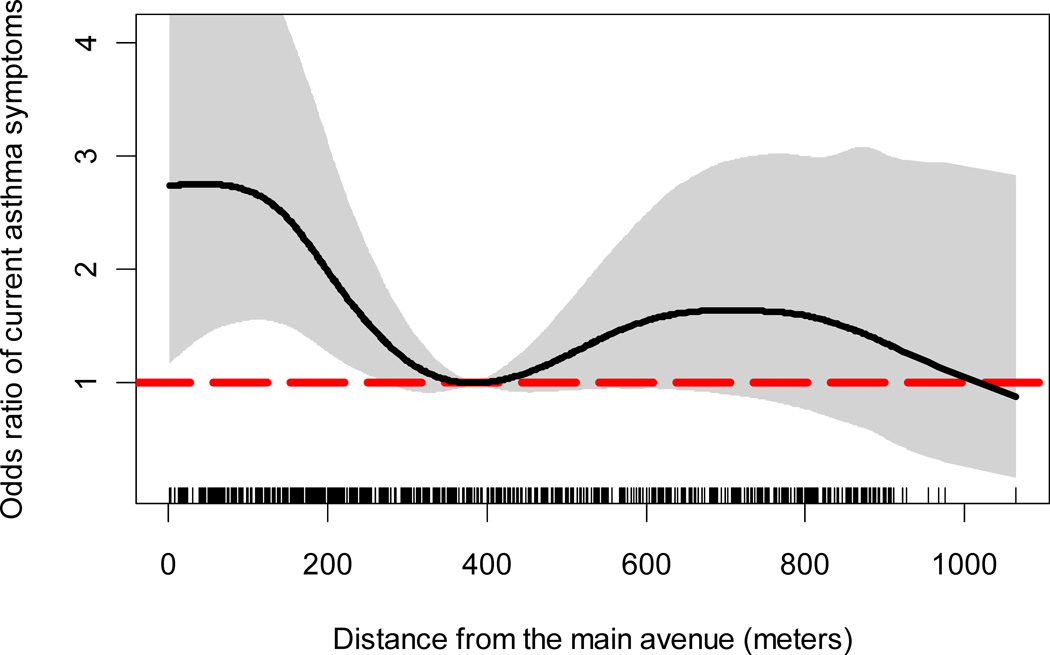
Figure II. Odds ratio of current asthma symptoms and distance from the main avenue (reference distance = 384 meters); Lima, Peru 2009–2010.
The thick black line represents the odds ratio of current asthma symptoms using 384 meters as the reference distance. The grey area represents the 95% bootstrap confidence intervals. The vertical segments in the x-axis represents the distribution of household distances from the main avenue.

