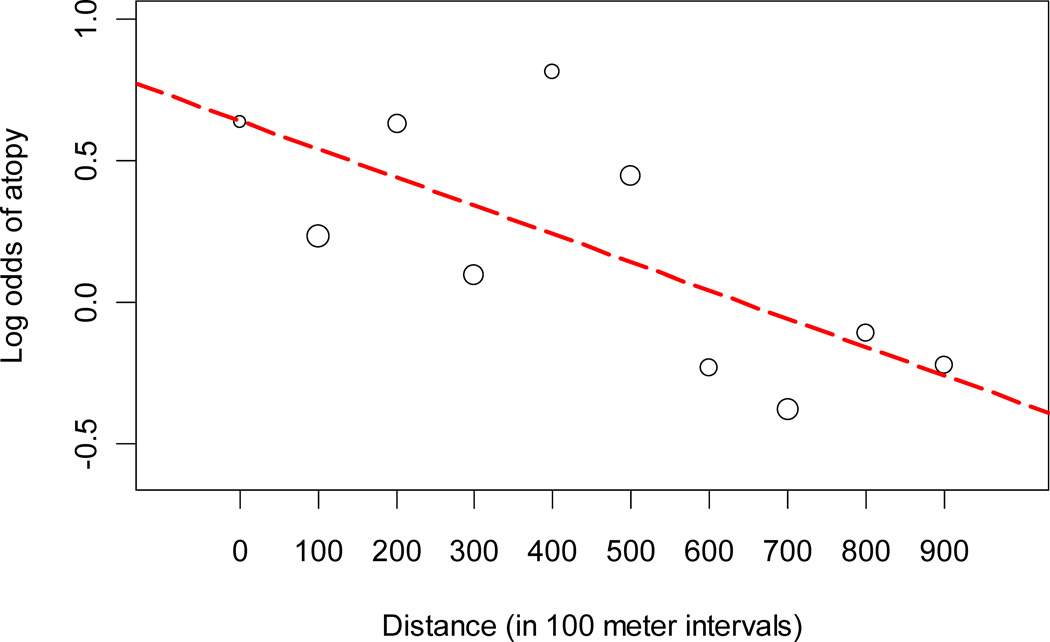
Figure III. Log odds of atopy and distance from the main avenue, Lima, Peru 2009–2010.
The circles represent the log odds of atopy calculated by 100-meter intervals of distance from the main avenue. The size of the circles is proportional the square root of the number of participants at each interval. The dashed red line represents a fitted line of the log odds of atopy by 100-meter intervals of distance from the main avenue.

