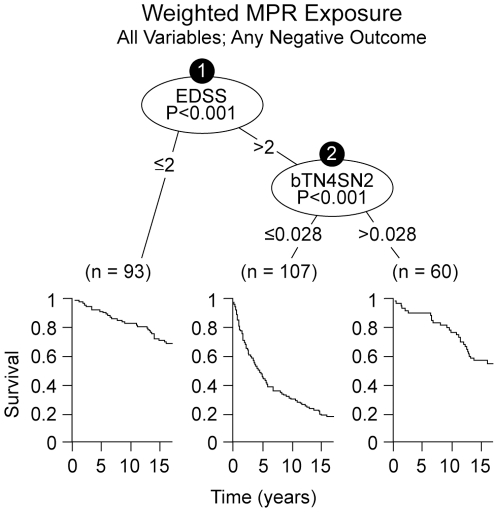
Figure 2. Optimal split determined by the recursive partitioning algorithm considering all predictor variables ( Table 2 ) together with all possible weighted-MPR exposures to IFNβ-1b.
Two highly significant split-levels were identified by the algorithm based on EDSS at the start of therapy and weighted IFNβ-1b exposure during the LTF. The first split (as in the Supplemental Material; Appendix S1; Figure S6) occurred at EDSS = 2, whereas a second level split occurred only for the EDSS>2 branch and was based on DMT exposure. Importantly, the algorithm for this analysis selected precisely the same weighting-scheme (bTN4SN2) that was selected in the Supplemental Material (Appendix S1; Figure S7). Survival curves are displayed below the identified subgroups and survival is best in the EDSS≤2 and the high-exposure groups. The split-point for DMT exposure is slightly different than that identified in the Supplemental Material (Appendix S1; Figure S7) because, in this instance, the split-point was determined only from the subgroup of patients with an EDSS>2. Note: the number (0.028) cannot be interpreted in time units because it represents a mathematical transformation from the raw exposure in years. In both Panels, the Kaplan-Meier survival estimates are displayed below each of the identified subgroups (splits). X-axis is time in years. Y-axis is survival in % (1 = 100%).

