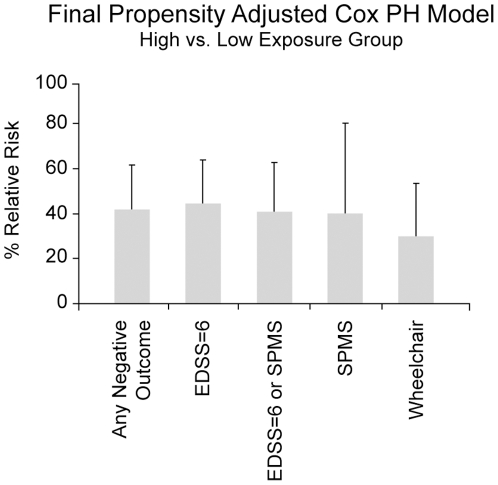
Figure 3. Propensity adjusted Cox proportional hazard estimates for the effect of treatment on each of the “hard” negative-outcomes examined in the study.
The results for our principal analysis (i.e., for “any negative-outcome”) are shown on the far left. For each of these outcomes, there is approximately a 60% to 70% long-term benefit to therapy. Error bars indicate the 95% CI for each the different outcomes.

