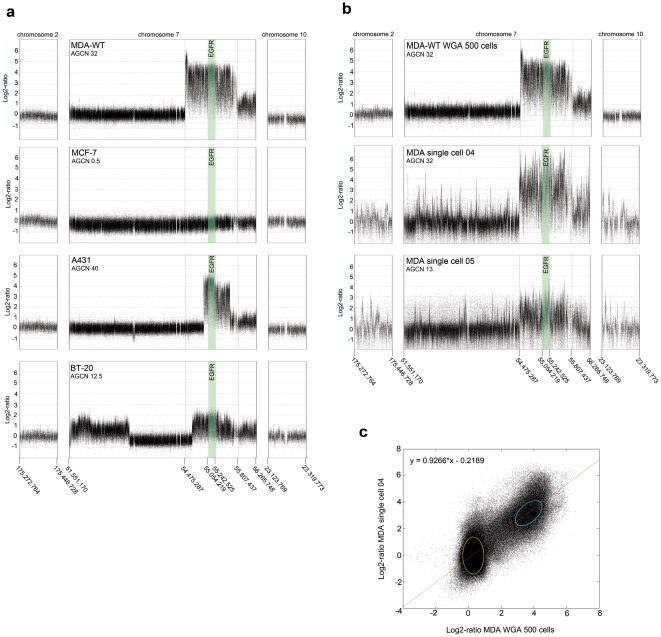
Figure 1. Fine-tiling array-CGH analyses.
a: Array-CGH plots of genomic DNA of different breast carcinoma cell lines with different EGFR gene copy numbers. b: Array-CGH plots of WGA amplified DNA from 500 MDA-MB-468 or single MDA-MB-468 cells (purchased at ATCC), respectively. The region of the EGFR gene is depicted in green. c: Correlation plot of the signal intensities after array hybridization comparing the signals of the DNA from one single MDA-MB-468 cell to the signals obtained from the DNA isolated from 500 MDA-MB-468 cells. Spots depicted in yellow represent the signals outside the amplicon region, whereas spots indicated by the blue color represent the signals obtained by the amplicon region on chromosome 7.

