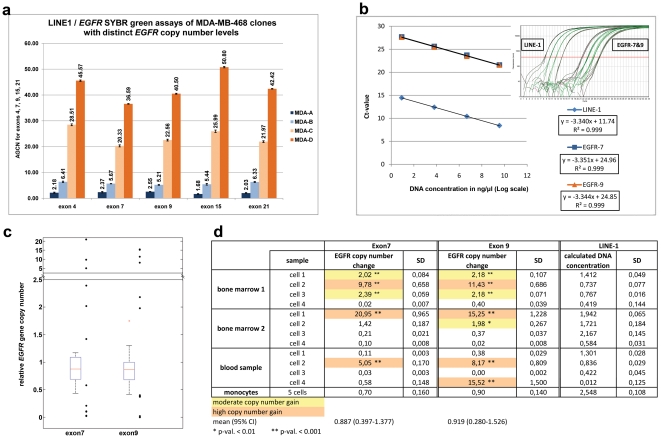
Figure 2. Quantitative PCR.
a: Quantitative PCR assays for different EGFR exons in MDA-MB-468 clones b: Calibration curves of the qPCR assays for the LINE-1 control and EGFR exons 7 and 9, which indicate that amplification efficiencies of the control as well as sample DNA are similar. c, d: Results of the qPCR analysis of exon 7 and 9 in single tumor cells from cancer patients. c: Boxplots of qPCR measurements of 10 non-tumourous cells from 3 different patients. The median of the values measured in non-tumour cells is about 0.9 (horizontal line in boxes). Values above 95% confidence limits 1.377 and 1.679 are considered to be gain of exon 7 and 9, respectively. The single black dots represent the values measured in tumor cells from patient samples, according to the table given in d.

