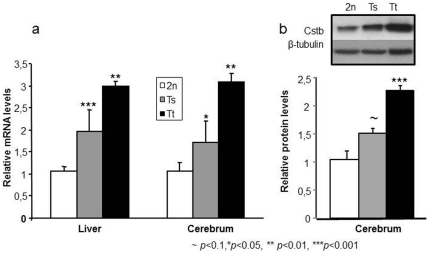
Figure 2. Analysis of Cstb expression in the liver and cerebrum of mice that are disomic (2n), trisomic (Ts) and tetrasomic (Tt) for Cstb.
(a) Real-time PCR analysis: mRNA levels are expressed relative to the disomique control. Data are represented as mean±sem. In both liver and cerebrum, Cstb expression is increased by ∼2 folds in the Ts and by ∼3 folds in the Tt mice. (b) Western blot analysis: band intensities were estimated using ImageJ and normalized against the loading control β-tubulin. Protein levels are represented as fold-changes relative to the 2n control and represented as mean±sem. Amounts of cystatin B are increased by about 1.5 fold in Ts and by about 2.3 fold in Tt brains. Inset shows one representative band for 2n, Ts and Tt.

