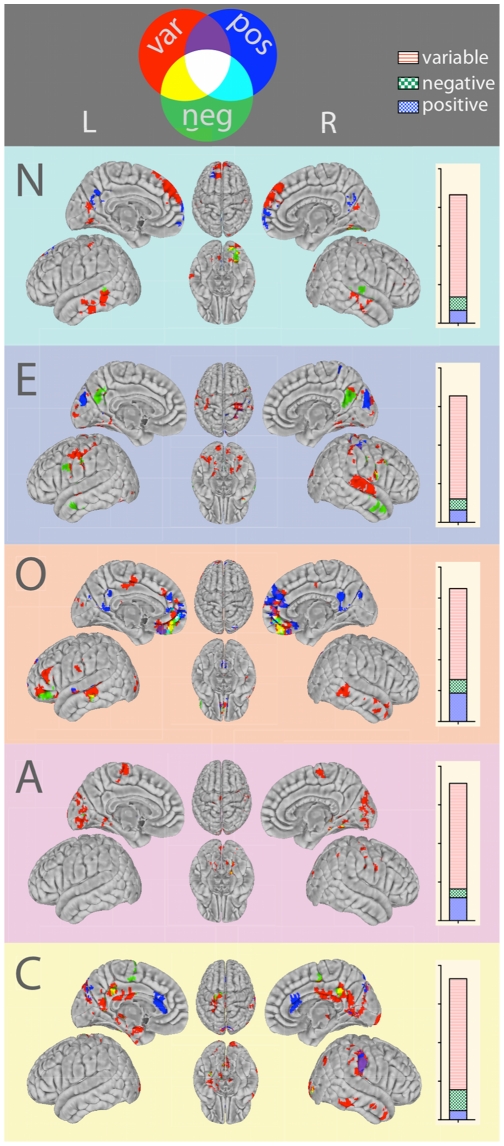
Figure 6. Functional connections predicted by personality are variable across participants.
Regions whose RSFC with ACC and PCU seeds was predicted by each of the five personality domains, grouped by color according to the valence of their RSFC—that is, whether the region was significantly (i.e., consistently) positively correlated (“invariant positive”; pos), significantly negatively correlated (“invariant negative”; neg), or not significantly correlated (“variable”; var) with the relevant seed region of interest, across all ACC and PCU seeds. Results are segregated by the relevant personality domain that predicted RSFC. Histograms to the right of the surface maps quantify the number of voxels identified as having a relationship with personality score, grouped according to their RSFC valence. As illustrated at the top of the figure, for both brain regions and histogram categories, blue corresponds to “positive” RSFC valence, green corresponds to “negative” RSFC valence, and red corresponds to “variable” RSFC valence. L = left hemisphere; R = right hemisphere; N = Neuroticism; E = Extraversion; O = Openness to Experience; A = Agreeableness; C = Conscientiousness.

