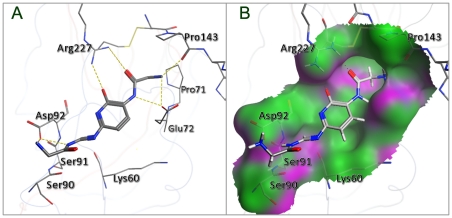
Figure 4. A close view to show the interaction of the receptor with the docked Neo6.
(A) The yellow dotted lines indicate the H-bond interactions of the receptor with Neo6. (B) The molecular surface is shown around the binding site of 3AL4; the hydrophobic surface is colored in green and the hydrogen bond surface in purple. See the text for further explanation.

