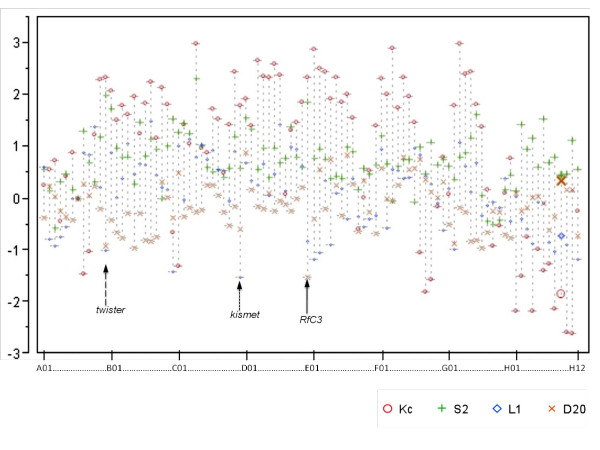
Figure 3.
Gene by gene overview of RNAi reporter gene expression. The overlay scatterplot indicates the expression level changes in luciferase reporter values, relative to no RNAi, in each of the cell lines. Each marker represents a specified cell line and each candidate cofactor dsRNAi treatment is arranged along the × axis in the order listed within the assay plate by row (letter) and column (number), also indicated on Table 1. Arrows indicate cofactors which show opposing polarity of transcriptional regulation, specific to indicated tissue types. Long dashed arrow indicates, twister. Short dashed arrow indicates kismet. Solid arrow indicates RfC3.

