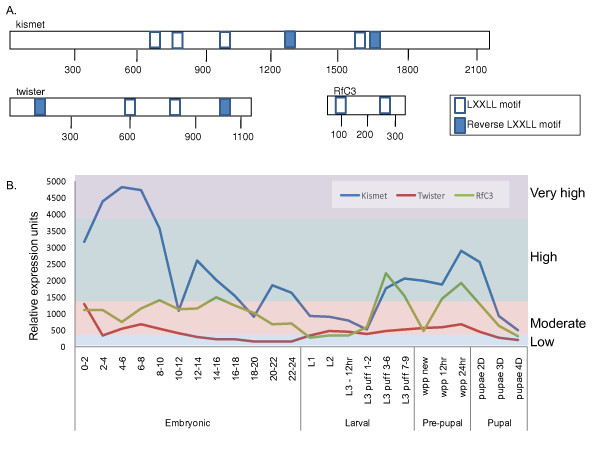
Figure 4.
Schematic of 3 common cofactor LXD motif and lifecycle expression. A. Schematic of common cofactor LXD motif protein domains. B. Lifecycle expression patterns, data retrieved from "flyatlas" database. Colored panels indicate relative expression levels as low (blue), moderate (red), high (green) and very high (purple).

