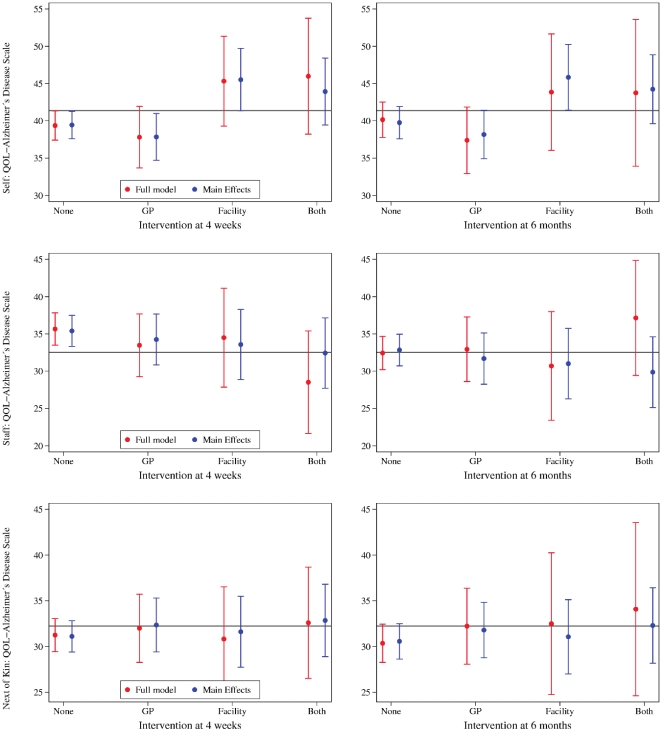
Figure 3. The figures show the effect of the intervention on quality of life scores according to patients (self), staff and next of kin 4 weeks and 6 months after the intervention.
The results exclude participants whose GPs did not complete the face-to-face education or whose facilities had less than 50% of staff taking part in the educational program. The horizontal reference line represents the mean score at baseline. The circles depict the mean score by group including all interactions, and after excluding group interactions. The vertical whiskers represent the 95% confidence interval of the mean score.

