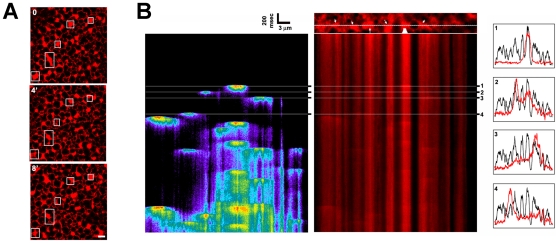
Figure 2. A. ER patches remodel continuously.
Examples of images from a time series from an egg expressing mCherry-KDEL (Scale bar, 2 µm). B. Elementary Ca2+ release events in the egg localize to ER patches. mCherry-KDEL expressing eggs injected with cIP3 and Oregon-green were line-scanned with the 405 nm laser on (0.2%). Left image show Ca2+ release events and the right ER distribution. The xy image with the linescan area is shown on top of the ER linescan. Histograms of Ca2+ release (red trace) and ER distribution (black trace) are shown for four selected areas as indicated by the numbers.

