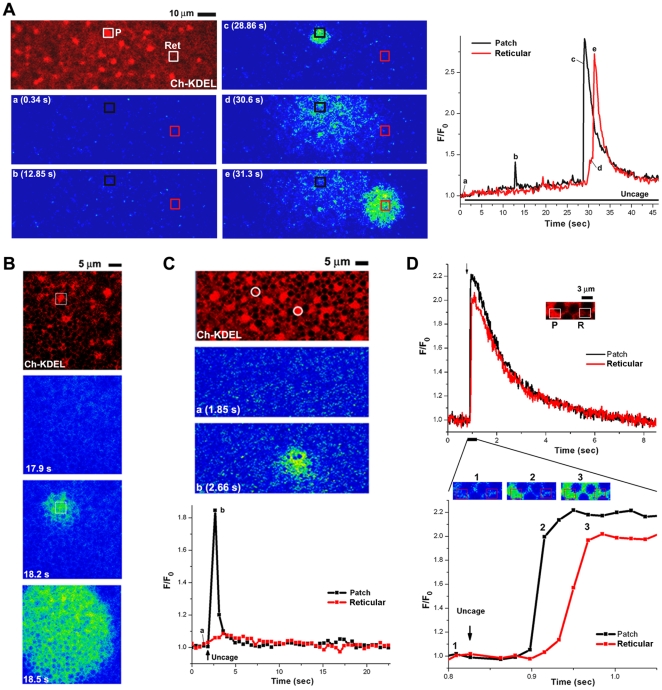
Figure 3. Sensitization of Ca2+ release in ER patches.
Eggs expressing mCherry-KDEL were injected with cIP3, and Oregon-green and imaged ∼1 hr after GVBD. A–B. IP3 receptors in ER patches respond to IP3 concentrations not detected by receptors in the reticular ER. ER distribution and Ca2+ release were imaged over time, while continuously uncaging cIP3 only within two ROIs as indicated by the boxes using the 405 nm laser. One ROI was placed over an ER patch (P) and the other over a reticular ER domain (Ret). Ca2+ release events over the entire time course within the two ROIs are shown on the right. B. Same experimental conditions as in A, except that uncaging with the 405 nm laser was performed over the entire field continuously. The white box shows the localization of the first release event to an ER patch. C–D. A single sub-threshold uncaging pulse results in preferential Ca2+ release from ER patches as compared to the reticular ER. In this case a single uncaging pulse was applied (405 nm laser 50% power) only within the circular ROIs (white circles) as indicated by ‘Uncage’ on the traces in the lower panel. One ROI is over an ER patch and the other over the reticular ER. D. Same imaging conditions over a small area (inset, 9.15×3 µm) where a single uncaging pulse was applied over the entire imaged area. Ca2+ release was then analyzed from two region as indicated by the boxes representing an ER patch and the neighboring reticular ER. The lower traces show an expanded time scale of Ca2+ release.

