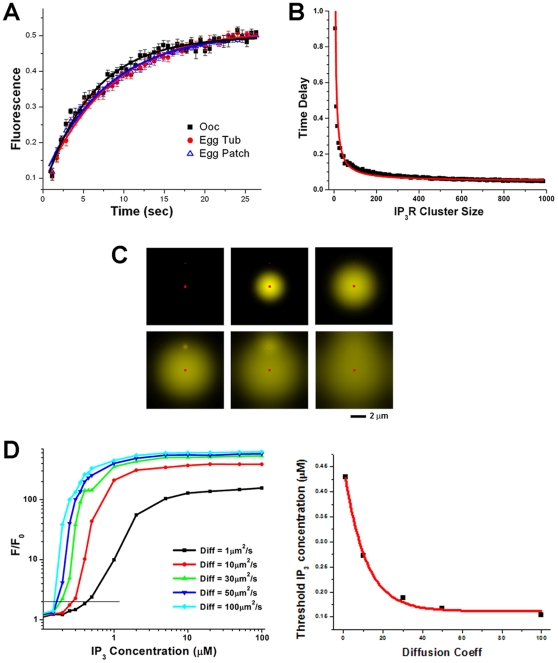
Figure 4. A. IP3 receptors lateral mobility in ER patches and reticular ER.
Fluorescence recovery after photobleaching (FRAP) in oocytes and eggs expressing GFP-IP3 receptor (n = 7–8; mean±SE). The bleaching ROIs in eggs were positioned over ER patches or reticular ER. Recovery kinetics were fitted with a monoexponential decay function. Recovery kinetics show that the lateral mobility of IP3 receptors is comparable within ER patches and the reticular ER. B–D. Mathematical modeling. Modeling the time delay in Ca2+ release as a function of IP3 receptor cluster size. As IP3 receptor cluster size increases the delay in response to an IP3 pulse decreases. C. Modeling Ca2+ release spatial and amplitude distribution from two IP3 receptor clusters of varying size (20 and 1000) in response to a sub-threshold IP3 pulse. D. Simulation of the dependence of Ca2+ release within an IP3 receptor cluster as a function of IP3 concentration for varying Ca2+ diffusion coefficients. Lowering the Ca2+ diffusion coefficient results in less Ca2+-dependent cooperativity between neighboring receptors. Decreasing Ca2+ diffusion coefficient leads to decreased sensitivity of IP3 receptors as illustrated by the threshold IP3 concentration required to initiate Ca2+ release.

