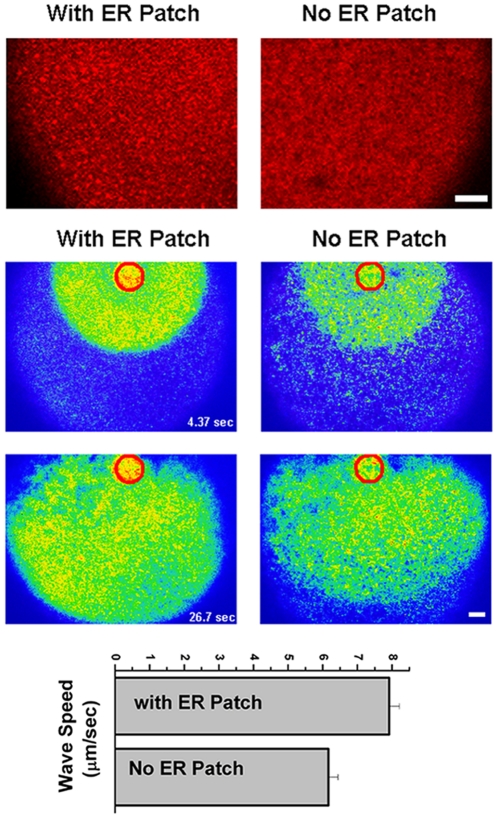
Figure 5. Role of ER remodeling in Ca2+ wave propagation.
Cells expressing mCherry-KDEL to visualize ER distribution were injected with caged-IP3 and Oregon-Green to image Ca2+ dynamics. Top panel shows an enlarged region from two cells, one with ER patches and one without. Ca2+ waves were induced by uncaging IP3 within an ROI (red circle) and wave propagation speed was measured. Example images of wave propagation are shown. These experiments were performed on the animal hemisphere (n = 12–13).

