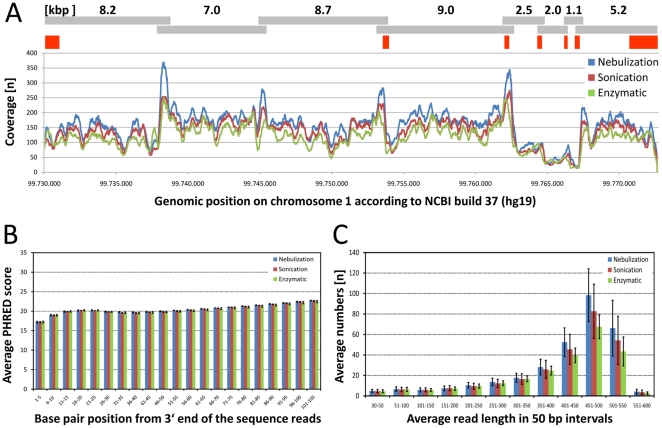
Figure 2. Coverage, sequence quality and read lengths of the 454 sequence run.
(A) Sequence coverage over the entire genomic region of the LPPR4 gene. The colors separate the results with respect to the fragmentation method. The gray bars above the graph depict the location and length PCR fragments [in kbp] and the red squares highlight the seven coding exons of the ENST00000370185 transcript. It becomes clear that the sequence coverage drops considerably for all three fragmentation methods if the PCR fragment size is below 3,000 bp. (B) Comparison of the sequence qualities scores (PHRED) at the 3′-ends of the sequences that have been generated using the three fragmentation methods. The bars depict the mean and standard deviation for three replicates of each fragmentation method, averaged over stretches of 5 base pairs. No significant difference was found between the three fragmentation methods. (C) Number of the sequence reads for different read lengths (averaged over stretches of 50 base pairs). The error bars depict the standard deviation of three replicates for each fragmentation method. This shows the variation between technical replicates to be larger than between the averages of the three fragmentation methods. No significant difference was found between the three methods.

