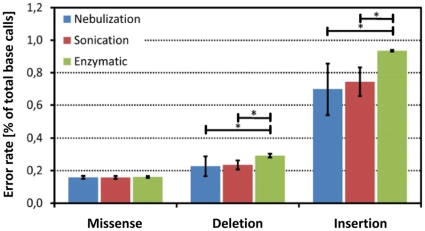
Figure 3. Comparison of the percentage of missense, deletion and insertion errors in individual sequence reads.
The error frequency was calculated according to Method#1 (see Materials and Methods section) with respect to the fragmentation method. The error bars depict the standard deviation. In order to classify a position on a sequence read as erroneous, the coverage of the respective position had to be >20 fold and the percentage of the alternative (erroneous) allele to be <20%. *, p<0.05.

