Figure 6.
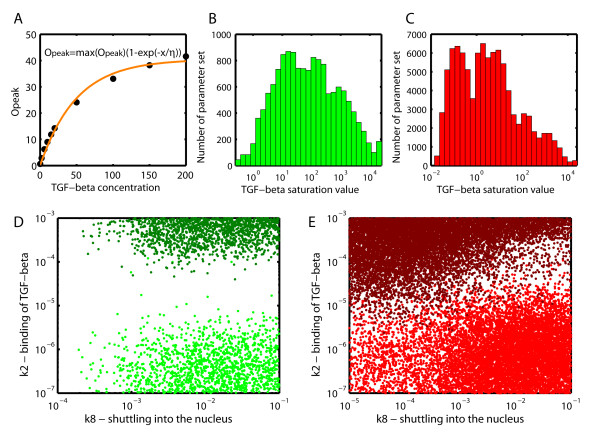
TGF-β dose-dependent response. (A) The pathway response increases with increasing ligand concentration until a plateau is reached. The saturation curve can be described with an exponential function, Opeak = max(Opeak)(1 - exp(-x/η)) where x refers to the ligand concentration (which was sampled at 12 concentrations between 0.2 pM and 20 nM), and the parameter η is characteristic for the saturation concentration. (B, C) A histogram of the distribution of η, the parameter characteristic for the saturation concentration for (B) the transient response, and (C) the sustained response. (D) For the transient set, the parameter that determines if the saturation concentration is high (green) or low (dark green) is k2, the binding rate of TGF-β to its receptor. (E) For the sustained set, two parameters are crucial. k2 (binding of TGF-β) and k8 (shuttling into the nucleus) set the saturation concentration either to high (red) or low (dark red).

