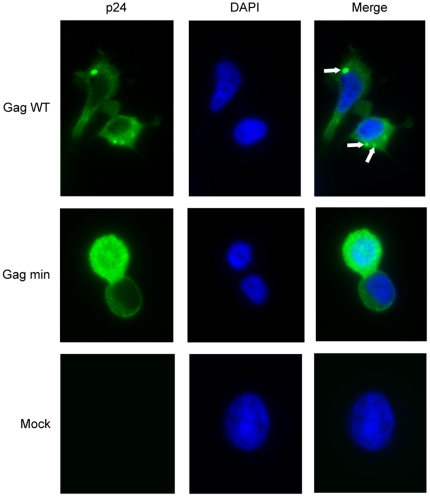
Figure 3. Gag min proteins show a diffuse distribution pattern.
293T cells were transfected either with Gag WT (upper panels), Gag min (middle panels) or pcDNA3.1 (+) vector (bottom panels). At 48 h post-transfection, cells were fixed and permeabilized for immunofluorescence assays as described in Materials and Methods . Nuclei were stained with DAPI. White arrows indicate a punctiform distribution of Gag proteins. The samples were visualized with a Nikon eclipse TE 300 inverted microscope (magnification: x 1,000). The experiment shown is representative of 3 independent experiments.

