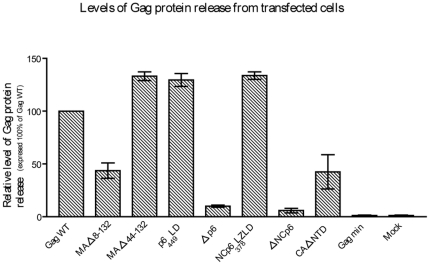
Figure 5. Quantitative analysis of VLP formation.
Gag protein signals from cell-free supernatants and cell lysates following transfection with the studied HIV-1 Pr55Gag-derived plasmids were quantified by scanning the band densities on the WB membranes using a Typhoon 9200 fluorescent laser scanner. Ratios of total Gag protein levels in the cell-free supernatants to those in cells extracts were determined for each construct, and compared with the same ratio for Gag WT. Results shown were obtained by dividing the release ratio for each mutant by the ratio for the Gag WT and multiplying by 100. Data shown represent at least three independent experiments for each mutant. Error bars indicate standard deviations.

