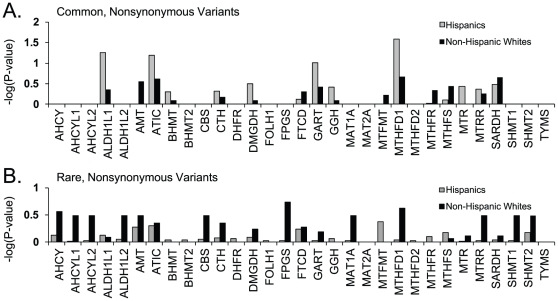
Figure 2. Allele Sums by Individual Gene.
Common and rare nonsynonymous changes were summed as in Figure 1 except here on a gene-by-gene basis rather than considering the pathway as a whole. –log (P-values) were calculated by permutation (but not adjusted for multiple comparisons) based on the case/control distributions within each gene in Hispanics and non-Hispanic whites. On the y-axis, 1.3 corresponds to P-value = 0.05.

